The Washington Wizards secured their second season sweep of an opponent this season, beating the Denver Nuggets in a fun game with lots of good signs for the future.
Last night’s contest had a familiar feel. The Nuggets built leads, the Wizards came back, and while the score stayed relatively close, it never really felt like Washington could actually win. Sure, they made a run at the end of the third quarter and even pulled into a lead early in the fourth when Nikola Jokic was resting. But it still had the flavor of an ephemeral feel-good moment that would come to a crashing halt when the three-time MVP returned to the floor.
And that’s even what happened. Jokic came back in, the Nuggets went back in front and seemed poised to close it out. But then, Jordan Poole went on a binge over the final 5:10, hitting four threes and a two, including the 35-foot game-winner with three seconds left.
Bright Spots for the Wizards
- While Poole provided the home-stretch heroics, it was young guys who carried the load for most of the night. Kyshawn George played a strong all-around game — 19 points on 11 field goal attempts, 7 rebounds, 5 assists, 3 steals, a block and 2 turnovers.
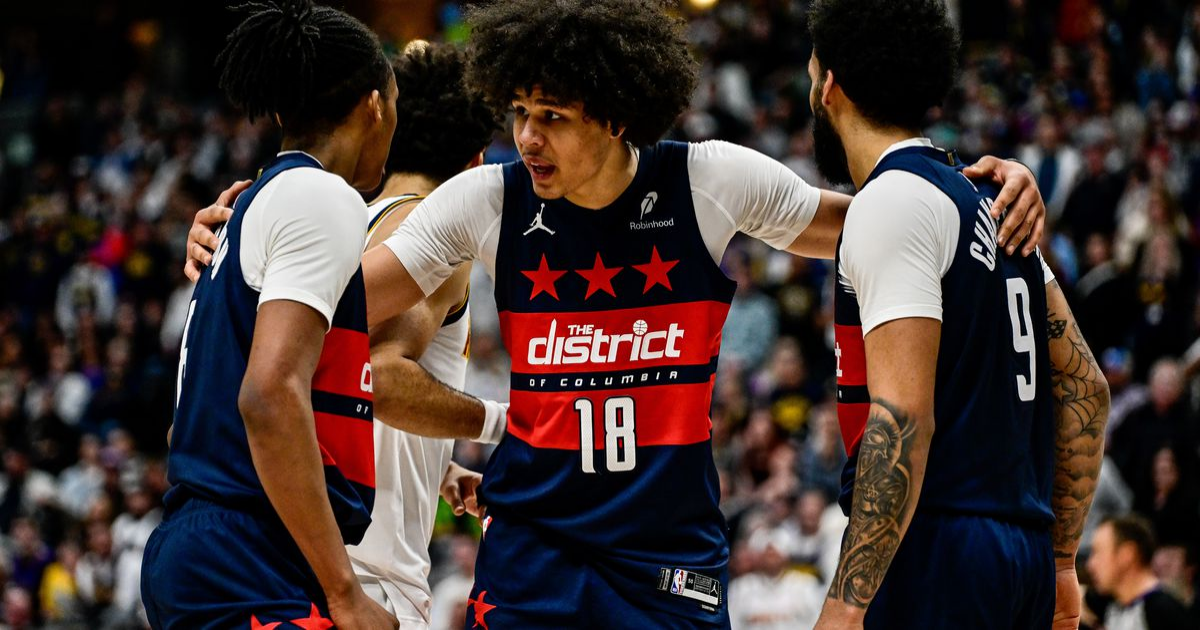
- Justin Champagnie started and had a strong game — 16 points and 13 rebounds in 39 minutes.
- Alex Sarr went on a scoring tear early, setting a new career high in the first half. He finished with 34 points, 6 rebounds (4 offensive boards), and 5 assists. His presence on the defensive end deterred several Nuggets from attempting shots in the paint. He had some rough moments against Jokic (doesn’t everyone?) and had a rough sequence in which he had four shots blocked in less than a minute, but he stayed aggressive and engaged at both ends.
- AJ Johnson notched a highly-efficient 9 points and 4 assists in 18 minutes.
- Poole’s heroics made up for what was a pretty rough game for his first 24 minutes of action. Through three quarters, he was just 2-5 from the floor with 6 turnovers. In the fourth, he was sensational — 14 points, 5-6 from the floor and 4-5 from three-point range.
Ramifications
The team’s recent spate of wins is putting in jeopardy Washington’s chances of finishing the season with the NBA’s worst record. The Wizards are 15-51 (already one win above my preseason forecast with 16 games to play). The Utah Jazz, who recently were fined by the NBA for blatant tanking. Specifically, they sat a healthy Lauri Markkanen against the Wizards and other recent opponents, are 15-52. The upcoming game between the two teams this Wednesday could have significant lottery implications.
The NBA’s flattened lottery odds mean that the Wizards won’t have a worse chance of getting the top pick if they finish with the second or third worst record instead of the worst. The bottom three teams each have a 14% chance of getting the number one pick. Where record comes into play is in worst case scenarios where teams with better records move up. In a worst case, the team with the worst record will pick no worse than fifth. Second worst, sixth, and so on. While talented — even great — players can often be found outside the top five, history shows that it’s best to pick near the top.
Four Factors
Below are the four factors that decide wins and losses in basketball — shooting (efg), rebounding (offensive rebounds), ball handling (turnovers), fouling (free throws made).
The four factors are measured by:
- eFG% (effective field goal percentage, which accounts for the three-point shot)
- OREB% (offensive rebound percentage)
- TOV% (turnover percentage — turnovers divided by possessions)
- FTM/FGA (free throws made divided by field goal attempts)
In the table below are the four factors using the percentages and rates traditionally presented. There’s also a column showing league average in each of the categories to give a sense of each team’s performance relative to the rest of the league this season.
FOUR FACTORS WIZARDS NUGGETS LGAVG FOUR FACTORS WIZARDS NUGGETS LGAVG eFG% 58.4% 56.8% 54.2% OREB% 28.9% 24.4% 25.2% TOV% 16.0% 16.0% 12.7% FTM/FGA 0.158 0.158 0.191 PACE 106 99.0 ORTG 119 116 114.3
Stats & Metrics
Below are a few performance metrics. PPA is my overall production metric, which credits players for things they do that help a team win (scoring, rebounding, playmaking, defending) and dings them for things that hurt (missed shots, turnovers, bad defense, fouls).
PPA is a per possession metric designed for larger data sets. In small sample sizes, the numbers can get weird. In PPA, 100 is average, higher is better and replacement level is 45. For a single game, replacement level isn’t much use, and I reiterate the caution about small samples sometimes producing weird results.
POSS is the number of possessions each player was on the floor in this game.
ORTG = offensive rating, which is points produced per individual possessions x 100. League average last season was 114.8. Points produced is not the same as points scored. It includes the value of assists and offensive rebounds, as well as sharing credit when receiving an assist.
USG = offensive usage rate. Average is 20%.
ORTG and USG are versions of stats created by former Wizards assistant coach Dean Oliver and modified by me. ORTG is an efficiency measure that accounts for the value of shooting, offensive rebounds, assists and turnovers. USG includes shooting from the floor and free throw line, offensive rebounds, assists and turnovers.
+PTS = “Plus Points” is a measure of the points gained or lost by each player based on their efficiency in this game compared to league average efficiency on the same number of possessions. A player with an offensive rating (points produced per possession x 100) of 100 who uses 20 possessions would produce 20 points. If the league average efficiency is 114, the league — on average — would produced 22.8 points in the same 20 possessions. So, the player in this hypothetical would have a +PTS score of -2.8.
Players are sorted by total production in the game.
WIZARDS MIN POSS ORTG USG +PTS PPA +/- WIZARDS MIN POSS ORTG USG +PTS PPA +/- Kyshawn George 40 88 139 15.1% 3.3 162 -3 Justin Champagnie 39 87 147 12.1% 3.5 160 13 Alex Sarr 32 70 118 38.5% 1.1 163 8 AJ Johnson 18 39 166 14.8% 3.0 210 7 Jordan Poole 30 67 110 24.5% -0.8 111 -3 Khris Middleton 20 44 121 19.6% 0.6 136 -6 Richaun Holmes 16 36 127 16.1% 0.8 131 -5 Corey Kispert 15 33 90 11.8% -0.9 28 -6 Bub Carrington 30 66 75 21.9% -5.7 -33 10
NUGGETS MIN POSS ORTG USG +PTS PPA +/- NUGGETS MIN POSS ORTG USG +PTS PPA +/- Jamal Murray 37 81 131 22.8% 3.1 270 19 Nikola Jokic 39 87 123 35.6% 2.6 205 6 Russell Westbrook 37 82 115 23.9% 0.2 138 0 Christian Braun 35 77 133 9.2% 1.4 129 -2 Michael Porter Jr. 37 82 121 17.4% 0.9 100 -13 Peyton Watson 23 50 92 8.3% -0.9 39 -22 Zeke Nnaji 21 46 82 16.2% -2.4 0 4 Jalen Pickett 9 21 73 11.8% -1.0 -30 -7 Vlatko Cancar 3 6 0 30.3% -2.0 -431 0