- Microsoft shares surged in extended trading Wednesday after the company issued quarterly results and guidance that topped Wall Street’s expectations. boosted by strong growth in its cloud business.
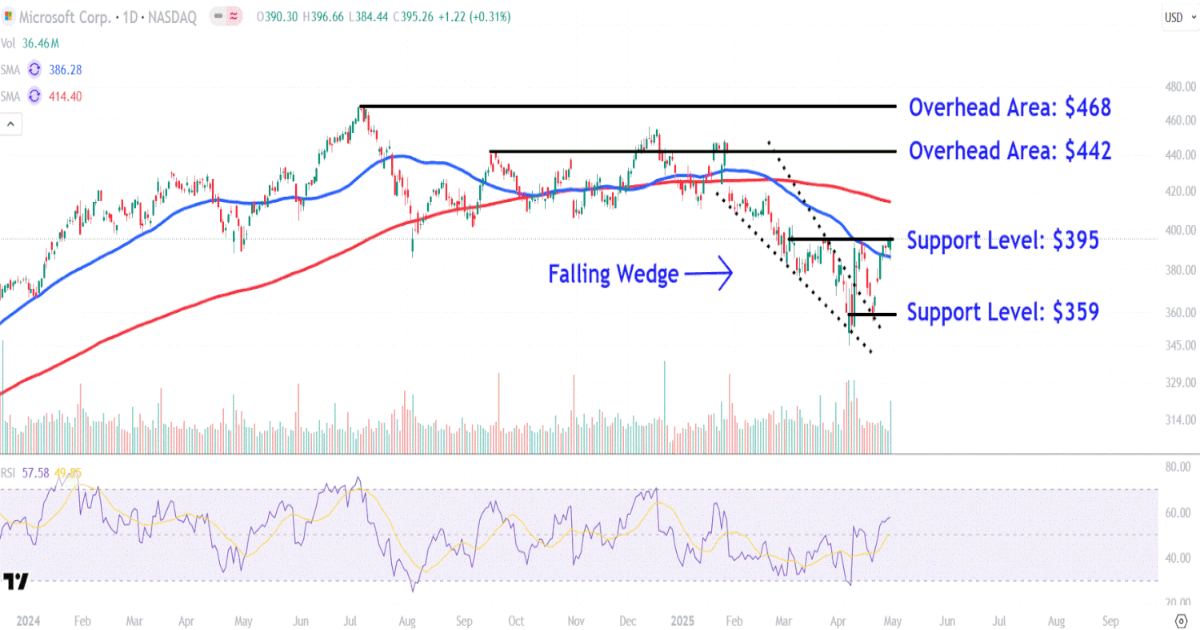
- The stock looks set to build on recent upward momentum after a successful retest of the top trendline of a falling wedge pattern, potentially setting the stage for a longer-term bullish reversal.
- Investors should watch two key overhead areas on Microsoft’s chart around $442 and $468, while also monitoring crucial support levels near $395 and $359.
Microsoft (MSFT) shares surged in extended trading Wednesday after the Windows maker issued fiscal third-quarter results and guidance that topped Wall Street’s expectations. boosted by strong growth in its cloud business.
CEO Satya Nadella said the company’s Intelligent Cloud segment, which houses its Azure cloud computing platform, continues to benefit from businesses’ need to expand output, reduce costs and accelerate growth, adding that Microsoft continues to innovate across its AI stack.
While Microsoft shares have risen 15% from their April low, they remain down 6% since the start of the year as of Wednesday’s close. Like other big tech names, concerns about sweeping tariffs and a reduction in AI spending continue to weigh on investor sentiment.
Microsoft shares rose nearly 7% to around $423 in after-hours trading.
Below, we take a closer look at Microsoft’s chart and use technical analysis to identify key price levels worth watching.
Following a successful retest of the top trendline of a falling wedge pattern, Microsoft shares staged a sharp move higher leading into the tech giant’s earning’s report, potentially setting the stage for a longer-term bullish reversal.
It’s also worth noting that the shares on Wednesday registered their highest trading volume in three weeks, suggesting that larger market participants, such as institutional investors and hedge funds, had positioned for a significant post-earnings move.
Let’s analyze Microsoft’s chart to identify two key overhead areas to watch, while also pointing out crucial support levels worth monitoring during future retracements.
The first overhead area to watch sits at around $442. This level may provide resistance near a trendline that roughly links several peaks that formed on the chart between September and January.
A decisive close above this level could see Microsoft shares make a move up toward the $468 area. Investors who have accumulated shares at lower price may look for profit-taking opportunities in this location near the stock’s record high set in July last year.
During future retracements in the stock, it’s worth tracking the $395 level near Wednesday’s closing price. This area on the chart has provided selling pressure over the last month around the late March countertrend high and mid-April peak following the stock’s initial breakout from the falling wedge pattern.
Finally, a deeper pullback could see Microsoft shares revisit lower support around $359. Investors may seek buying opportunities in this region near last week’s trough situated just above this month’s significant swing low.
The comments, opinions, and analyses expressed on Investopedia are for informational purposes only. Read our warranty and liability disclaimer for more info.
As of the date this article was written, the author does not own any of the above securities.